Chapter 3: SECTORS OF THE INDIAN ECONOMY
Topics in this chapter
· Role & Importance of Primary, Secondary, Tertiary Sector, Quaternary & Quinary Sectors,
· Different Revolutions in Primary sector,
· Difference between the sectors,
· GDP contribution of different sectors,
· Agriculture,
· Industry,
· Services,
· Employment growth rate in Secondary sector,
· Sunrise Sector of Indian Economy,
· Organised and Unorganised sectors
The Sectors of the Indian Economy form the backbone of India’s economic structure. Understanding the Sectors of the Indian Economy is essential for JAIIB aspirants as it helps in analyzing GDP trends, employment patterns and structural transformation.
3.1 ROLE & IMPORTANCE OF PRIMARY, SECONDARY, TERTIARY SECTOR, QUATERNARY & QUINARY SECTORS
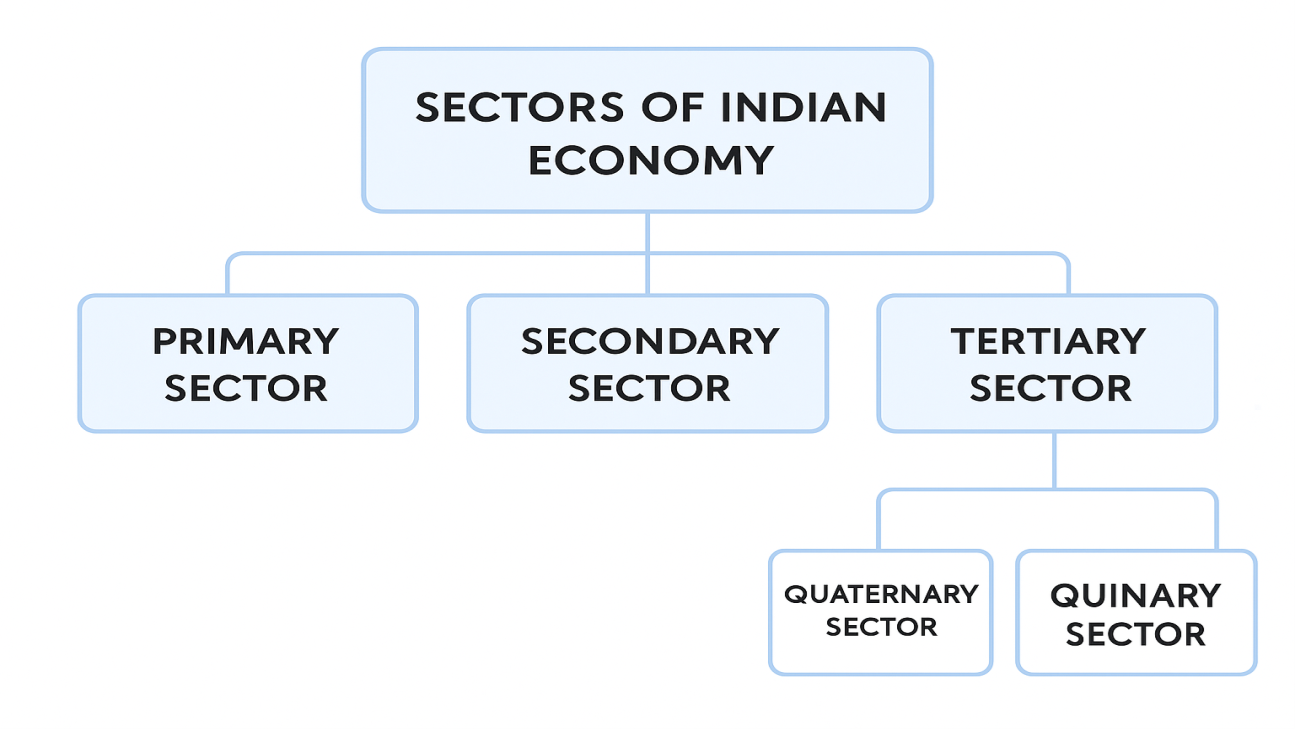
Sectors of the Indian Economy are broadly divided into primary, secondary and tertiary sectors based on economic activities-
Primary Sector
This sector includes all economic activities that involve the direct use of natural resources. It is the foundation of the economy.
· Examples: Agriculture, forestry, fishing, mining for fuels, metals, and minerals.
· An economy is called an agrarian economy if the agriculture sector provides at least 50% of the country’s national income and livelihood.
Secondary Sector
This sector includes all economic activities that involve processing the raw materials extracted from the primary sector. It is also called the industrial sector.
· Examples: Manufacturing is a key sub-sector.
· An economy is called an industrial economy if the secondary sector generates at least half of the country’s national GDP and employment.
Tertiary Sector
This sector includes all economic activities that produce services rather than physical goods.
· Examples: Education, healthcare, banking, transportation, and communication.
· An economy is called a service-based economy if the tertiary sector generates at least half of the country’s national income and livelihood.
In addition to these three main sectors, economists have introduced two more sub-sectors of the tertiary sector:
Quaternary Sector
This is also known as the ‘knowledge’ sector. This category includes activities related to information and knowledge. It is a very important sector for assessing the strength of a country’s human resources.
· Examples: The work of employees in office buildings, schools and universities, hospitals and doctors’ offices, theatres, and accounting and brokerage firms.
Quinary Sector
This sector includes the highest level of decision-making in an economy. The number of people working in this sector is small, but they are considered the “brain” behind an economy’s socioeconomic performance.
· Examples: Senior company executives, high-ranking government officials, research scientists, and financial and legal advisors.
3.2 DIFFERENT REVOLUTIONS IN PRIMARY SECTOR
Agriculture has always been the most important industry in India. Traditionally, it was characterized by subsistence farming (growing just enough to live on), reliance on rain, and a focus on food grains, with little diversification or commercialisation. With a growing population and rising incomes, the demand for agricultural goods has skyrocketed.
To meet this demand, the government of India has carried out a series of “revolutions” in the primary sector to increase production capacity. The most important of these are listed below:
|
Revolution Name |
Related To |
Father / Key Person |
Time Period |
|
Green Revolution |
Agriculture (Food Grains) |
Mr. M.S. Swaminathan |
1966 – 1978 |
|
White Revolution (Operation Flood) |
Milk / Dairy products |
Mr. Verghese Kurien |
1970 – 1996 |
|
Yellow Revolution |
Oil Seeds |
Mr. Sam Pitroda |
1986 – 1990 |
|
Blue Revolution |
Fish & Aquaculture |
Dr. Arun Krishnan |
1973 – 2002 |
|
Golden Revolution |
Fruits, Honey, Horticulture |
Mr. Nirpakh Tutej |
1991 – 2003 |
|
Golden Fibre Revolution |
Jute |
– |
1990s |
|
Silver Revolution |
Eggs |
Mrs. Indira Gandhi |
1969 – 1978 |
|
Silver Fiber Revolution |
Cotton |
– |
2000s |
|
Pink Revolution |
Pharmaceuticals, Prawns, Onion |
Mr. Durgesh Patel |
1970s |
|
Brown Revolution |
Leather, Cocoa |
Mr. Hirlal Chaudri |
– |
|
Red Revolution |
Meat, Tomato |
Mr. Vishal Tewari |
1980s |
|
Grey Revolution |
Fertilisers |
– |
1960s – 1970s |
|
Evergreen Revolution |
Overall Agricultural Production |
M.S. Swaminathan |
2014 – 2022 |
|
Black Revolution |
Petroleum |
– |
– |
|
Round Revolution |
Potato |
– |
1965 – 2005 |
|
Protein Revolution |
Agriculture (Higher Production) |
Coined by Mr. Narendra Modi |
2020 |
3.3 DIFFERENCE BETWEEN THE SECTORS
The main difference between the sectors lies in the nature of their activities.
The table below highlights the most significant variations.
|
Primary Sector |
Secondary Sector |
Tertiary Sector |
|
Activities: Includes agriculture, forestry, and mining. |
Activities: Includes manufacturing units, small-scale units, and large corporations. |
Activities: Involves services like banking, insurance, and communications. |
|
Also Known As: Agriculture and allied services sector. |
Also Known As: Industrial or manufacturing sector. |
Also Known As: Service sector. |
|
Role: Provides raw materials for goods and services. |
Role: Transforms one good into another by adding value to it. |
Role: Offers valuable services to the primary and secondary sectors. |
|
Methods: Mostly unorganised and often uses traditional methods. |
Methods: Organised and uses more efficient production methods. |
Methods: Well-organised and uses advanced logistics and techniques. |
|
Employment: In developing countries like India, this sector employs a large part of the workforce. |
Employment: Requires a particular set of skills, so the employment rate is often in equilibrium. |
Employment: This sector’s share of employment has risen dramatically in recent years. |
3.4 GDP CONTRIBUTION OF DIFFERENT SECTORS
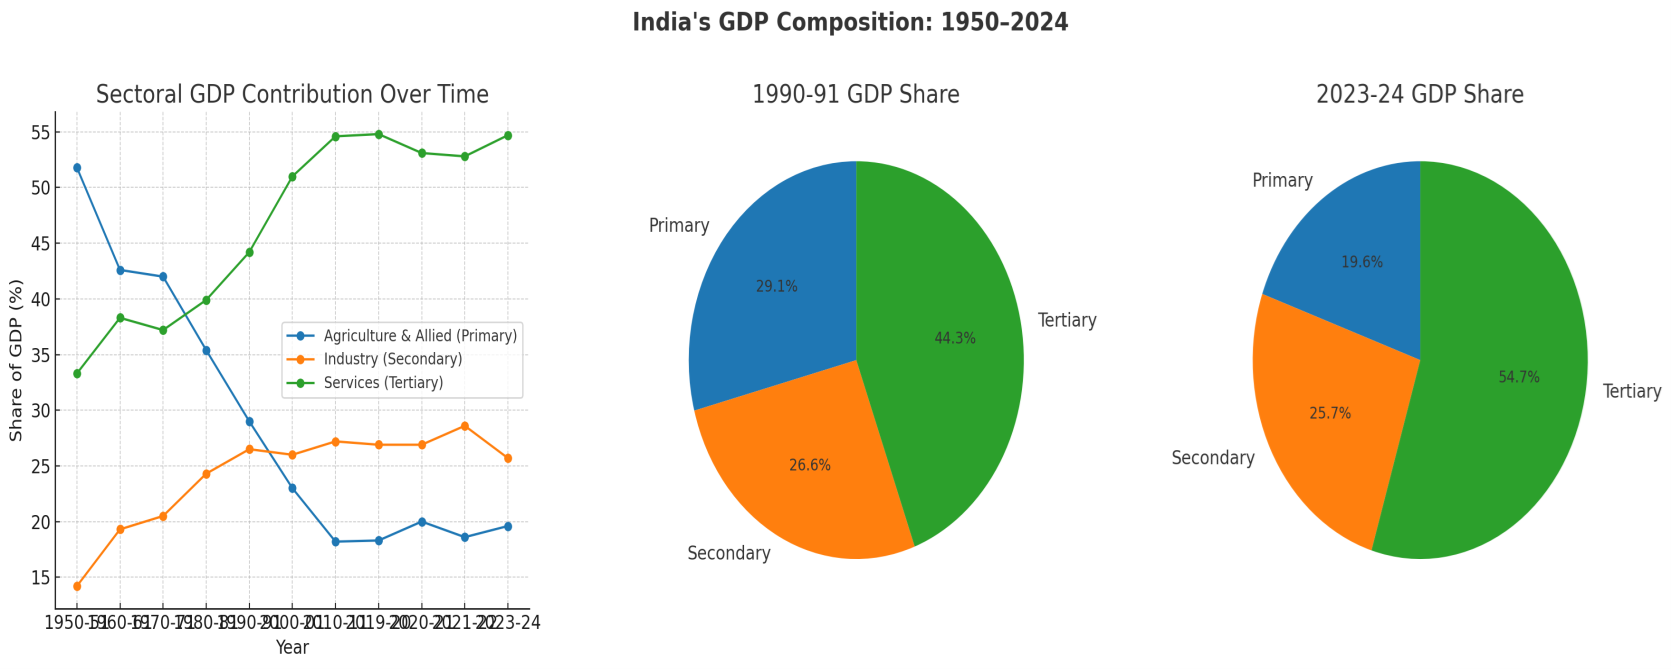
The GDP contribution of the Sectors of the Indian Economy has changed significantly over time. By the late 1990s, the Indian economy had transitioned from being dominated by agriculture to being dominated by services, with the services sector accounting for over half of the national GDP. Today, the agriculture sector accounts for about 19% of the total GDP. The services sector contributes more than 54%, while the secondary sector contributes the remaining 27%.
The table and pie charts below show the changing contribution of different sectors to the economy over the decades.
Sector-wise Contribution to Indian GDP (1950-2024)
|
Year |
Primary Sector (Agriculture & Allied) |
Secondary Sector (Industry) |
Tertiary Sector (Services) |
|
1950-51 |
51.8% |
14.2% |
33.3% |
|
1960-61 |
42.6% |
19.3% |
38.3% |
|
1970-71 |
42.0% |
20.5% |
37.2% |
|
1980-81 |
35.4% |
24.3% |
39.9% |
|
1990-91 |
29.0% |
26.5% |
44.2% |
|
2000-01 |
23.0% |
26.0% |
51.0% |
|
2010-11 |
18.2% |
27.2% |
54.6% |
|
2019-20 |
18.3% |
26.9% |
54.8% |
|
2020-21 |
20.0% |
26.9% |
53.1% |
|
2021-22 |
18.6% |
28.6% |
52.8% |
|
2023–24 |
19.62% |
25.66% |
54.72% |
Sources: MOSPI-based sector shares compiled by StatisticsTimes (updated Oct 2, 2024). For broader context on FY 2023–24 composition, and Economy of India page.
The transformation of the Sectors of the Indian Economy reflects India’s structural development.
3.5 AGRICULTURE
Agriculture has always been the most significant sector in India. It is not only the largest sector but also the biggest private sector. It is the main unorganised sector of the economy.
While agriculture’s share of the country’s gross income has been declining, the industrial and service sectors’ shares have been steadily increasing. This is because the industrial and service sectors have expanded at a faster rate than agriculture. However, agriculture has seen satisfactory development due to improved technology, irrigation, inputs, and pricing strategies.
As per the Ministry of Agriculture & Farmers’ Welfare (Report of 2024-25):
“Agriculture plays a vital role in India’s economy. 54.6% of the total workforce is engaged in agricultural and allied sector activities (Census 2011) and it accounts for 18.6% of the country’s Gross Value Added (GVA) for the year 2021-22. Given the importance of the agriculture sector, the Government of India has taken several steps for its development in a sustainable manner.”
As per the Land Use Statistics 2022-23, the total geographical area of the country is 328.7 million hectares. The net area sown is 140.7 million hectares, which is 42.8% of the total geographical area.
3.6 INDUSTRY
The industrial sector is equally vital for the economy as it promotes economic growth, provides employment, and creates demand for agricultural products. India’s industrial sector is divided into four sub-sectors:
1. Mining and quarrying
2. Manufacturing
3. Power, Gas, Water supply, and other utility services
4. Construction
Manufacturing accounts for about 18% of the total Gross Value Added (GVA), while construction accounts for around 8%. The journey of Indian industry can be summed up in four phases:
· Phase I (1951–1965): The period of industrial foundation.
· Phase II (1965–1980): The period of industrial decline.
· Phase III (1980–1991): The period of industrial recovery.
· Phase IV (1991 onwards): The post-reform period.
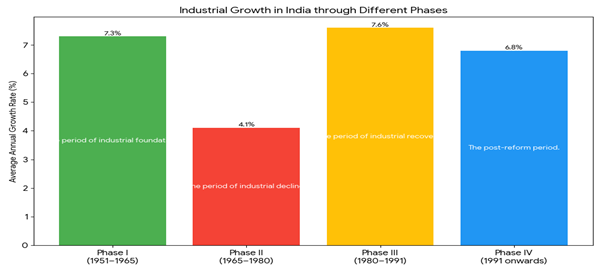
Source: Reserve Bank of India, Handbook of Statistics on Indian Economy.
The Index of Industrial Production (IIP) measures the change in the volume of industrial production. The Index of Core Industries (ICI) tracks the growth of eight key industries: refinery products, electricity, steel, coal, crude oil, natural gas, cement, and fertilisers.
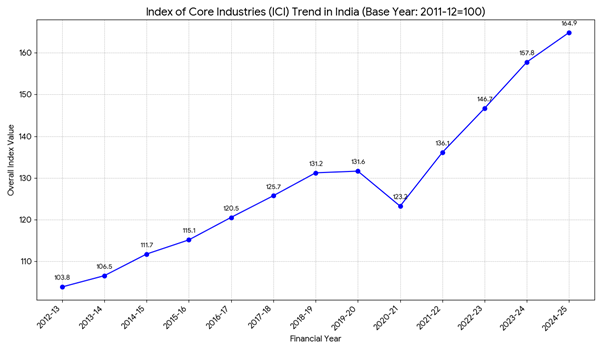
Source- The Office of the Economic Adviser, Department for Promotion of Industry and Internal Trade (DPIIT), Ministry of Commerce and Industry, Government of India.
3.7 SERVICES
The services sector in India encompasses a wide range of intangible goods and services, including trade, hotels, transport, communication, financial services, real estate, and public administration. This sector has experienced significant growth over the decades, reflecting the country’s economic transformation.
Contribution to GDP
As of the fiscal year 2023–24, the services sector accounted for approximately 54.72% of India’s Gross Value Added (GVA), amounting to ₹146.44 lakh crore out of a total GVA of ₹267.62 lakh crore. This marks a substantial increase from 33% in 1950 and 53% in 2021–22, underscoring the sector’s expanding role in the economy .
Employment Trends
Despite its dominant share in GVA, the services sector’s contribution to employment is relatively modest. According to the International Labour Organization (ILO), in 2021, 31% of India’s workforce was employed in the services sector, compared to a global average of 49.7% . This disparity highlights the sector’s capital-intensive nature and the need for policies that promote inclusive employment growth.
Export Performance
India has emerged as a global leader in services exports, particularly in the software and information technology (IT) sectors. In the fiscal year 2022–23, India’s software exports reached a record $320 billion, accounting for approximately 11% of global computer services exports . This growth is driven by increasing demand for digital support, cloud services, and infrastructure modernization.
Foreign Direct Investment (FDI)
The services sector continues to attract significant foreign direct investment (FDI). According to the World Investment Report 2022 by UNCTAD, India was the seventh-largest recipient of FDI among the top 20 host countries in 2021 . This influx of FDI underscores the sector’s attractiveness to global investors and its potential for further expansion
3.8 EMPLOYMENT GROWTH RATE IN SECONDARY SECTOR
Employment trends across the Sectors of the Indian Economy highlight structural imbalance. The following table shows the employment pattern in India:
|
Industrial Category |
Rural Residence |
Urban Residence |
Male |
Female |
Total |
|
Primary |
66.6% |
9.0% |
43.6% |
62.8% |
48.9% |
|
Secondary |
16.0% |
31.0% |
25.9% |
20.0% |
24.3% |
|
Service/Tertiary |
17.4% |
60.0% |
30.5% |
17.2% |
26.8% |
The manufacturing sector employed approximately 1.85 crore workers in the fiscal year 2022–23, marking a 7.5% increase from the previous year. This growth was driven by key segments such as metals, petroleum, food products, and motor vehicles. Despite this increase, manufacturing still accounts for a modest share of total employment in India.
The construction sector is one of the largest employment generators in India. As of 2021–22, it employed 12.4% of the total workforce, up from 11.6% in 2019–20. This sector plays a crucial role in providing jobs and stimulating growth through its backward and forward linkages.
3.9 SUNRISE SECTOR OF INDIAN ECONOMY
The rise of sunrise industries marks a new phase in the Sectors of the Indian Economy. A sunrise sector is an industry that is still new but has the potential for significant growth in the future. It is often characterized by strong growth rates, a high degree of innovation, and high public awareness.
Existing Indian industries that can be categorized as Sunrise Sectors are likely to benefit the economy in terms of job creation and business growth. These include:
· Green Energy
· Fintech
· Information Technology
· Electronics
· Pharmaceuticals
· Automobiles
· Healthcare
· Infrastructure Sector
· Retail Sector
3.10 ORGANISED AND UNORGANISED SECTORS
Organised and unorganised segments form an important part of the Sectors of the Indian Economy.
Organised Sector
The organised sector is one in which the job terms are fixed and regular, and the employees are guaranteed work. It includes businesses, schools, hospitals, and units that are registered with the government. In the organised sector, job terms are stable, and employees have guaranteed work and social security benefits.
Unorganised Sector
The unorganised sector, on the other hand, is one in which employment terms are not defined and regular, and the enterprises are not registered with the government. It includes construction workers, domestic workers, street vendors, and those working in tiny workshops. This sector is characterized by low wages, unstable and irregular work, and a lack of protection from laws or trade unions.
Difference between Organised and Unorganised sectors
|
Basis for Comparison |
Organised Sector |
Unorganised Sector |
|
Meaning |
A sector where employment terms are fixed and regular, and employees get assured work. |
Characterized by small and scattered units, which are largely not registered with the government. |
|
Governed by |
Various acts like the Factories Act, Bonus Act, PF Act, Minimum Wages Act, etc. |
Not governed by any specific act. |
|
Government rules |
Strictly followed. |
Not strictly followed. |
|
Remuneration |
Regular monthly salary. |
Daily wages. |
|
Job security |
Yes, workers enjoy the security of employment. |
No, employment is not secure. People can be asked to leave without any reason. |
|
Working hours |
Fixed. |
Not fixed. |
|
Salary of workers |
As prescribed by the government. |
Often less than the salary prescribed by the government. |
|
Contribution to Provident Fund |
Yes, the employer contributes. |
No. |
|
Benefits and perquisites |
Employees get add-on benefits like medical facilities, pension, leave travel compensation, etc. |
Not provided. |
|
Examples |
Government employees, registered industrial workers, etc. |
Shopkeeping, Farming, Domestic work, etc. |
 Click below to download the full PDF study material for this chapter:
 Download This Chapter’s PDF